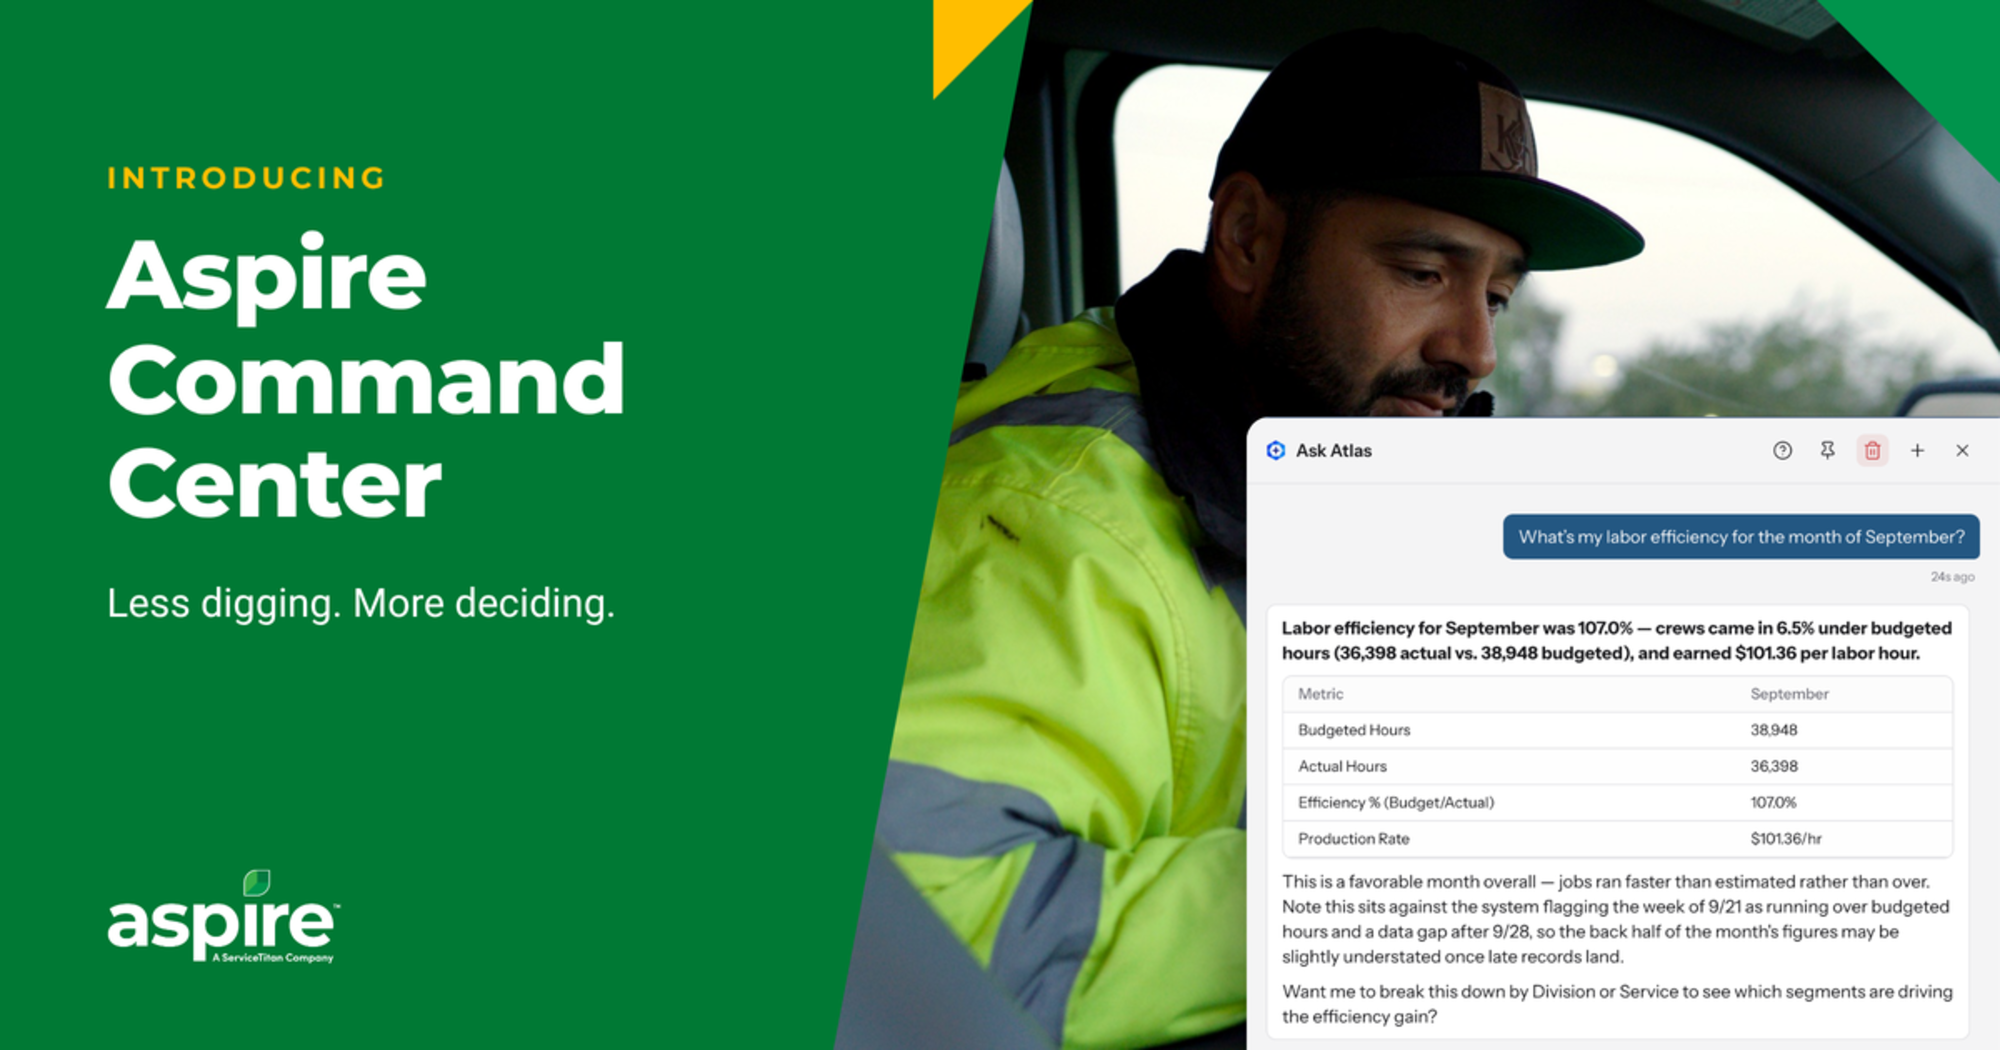
Less digging. More deciding.
You put a lot of information into Aspire: every job, crew hour, invoice, and purchase receipt. Getting answers back out can take time. Say labor costs are climbing. Is it overtime? Too much drive time? A job that was underbid? Finding out might mean pulling several reports, comparing numbers, and digging into individual jobs.
Introducing Aspire Command Center, a new AI-powered tool that gives you a clearer view of your business. It looks at your live Aspire data so you can ask questions, catch costly mistakes, track performance, and see what needs attention. You get the information you need to make better decisions without the hours of pulling reports and comparing numbers.
Here's a closer look at what Command Center can do.
Ask questions about your business with Atlas
One of Command Center's most powerful features is Atlas, its built-in AI assistant. Ask questions about your business in plain English, and Atlas answers based on your Aspire data. Start with a simple question, and Atlas guides follow-up questions to investigate a problem, explore trends, or understand what's driving your numbers without ever needing to run a report.
Find problems hiding in your data
Mistakes in your records can be hard to spot, and some are nearly impossible to find on your own. Command Center looks across your jobs and flags the ones that need attention, including jobs where the numbers don’t add up.
A typo in a purchase receipt amount is a good example. It can quietly throw off a job’s costs. Command Center brings it to the surface, you correct the entry in Aspire, and the error stops showing up in later analysis.
Early users have also used it to spot inaccurate data and see where corrections are needed.
Make better scheduling decisions when the weather changes
Rain and other weather delays force landscape companies to reschedule crews and push back job completion dates, affecting productivity, invoicing, and cash flow. Atlas includes weather context, so users can adjust their schedule proactively without opening a weather app.
Ask, "Which jobs should we consider rescheduling based on this week's forecast?" Atlas evaluates scheduled work alongside weather conditions and helps identify jobs that may need to move. You can also ask about payment terms and cash flow to help prioritize jobs that are invoiced upon completion.
Ask Atlas from anywhere
Atlas also works on mobile, so you’re never disconnected from getting deep insights into your operations. Ask questions using your phone's dictation feature while you're in the field or traveling between properties. Conversations are saved, so you can return to previous questions and continue investigating when you get back to the office, without starting over. If Atlas identifies something you want to monitor regularly, just ask it to create a widget or dashboard based on that information.
Build dashboards around the way you run your business
While Atlas helps you investigate specific questions, Command Center's customizable dashboards monitor performance over time. Bring labor efficiency, job profitability, crew performance, and other important metrics into one place, with different views for different areas of your business.
Dashboards and widgets work together
Each dashboard contains individual charts, graphs, and metrics called widgets. Each widget tracks a specific measure or answers a particular question. For example, a labor efficiency dashboard might include widgets showing labor hours by crew, drive time, estimated versus actual labor hours, labor efficiency across branches, and overtime trends.
Together, these widgets provide a broader view of labor performance and help identify areas that may need attention. Command Center includes a library of prebuilt dashboards you can install and populate with your own Aspire data. Use an existing dashboard as a starting point or create one from scratch.
Make every dashboard your own
Once you open a dashboard, you can customize the information it displays and how it's organized.
Change the date range. For example, switch from six months to 30 days, and the dashboard updates to reflect the selected period.
Dig into the details. Click supported widgets to explore the underlying information. Some link directly into Aspire, where you can investigate issues and make corrections.
Filter the information. Narrow your view by division, branch, sales rep, company, or account owner, depending on the dashboard.
Adjust the layout. Move and resize widgets, add new ones, or remove those you don't need.
Share dashboards with your team. Send a link or subscribe to receive a dashboard by email on a regular schedule.
Create different views. Clone and modify an existing dashboard or keep one private.
You can also change the performance thresholds used for the green and red indicators on your charts. This allows you to measure results against your company's targets rather than relying solely on default benchmarks.
Create widgets and dashboards by describing what you need
Command Center lets you create charts without building reports manually. For example, if you want to compare drive time across crews, click Add Widget, choose a chart type, and enter "Show me drive time by crew." Command Center generates the chart using your Aspire data, and you can add it to your dashboard with one click. You can create additional widgets the same way and remove them when they're no longer needed.
For an entire dashboard, use AI Builder. Enter a request such as "Build a dashboard to help manage my business," and Command Center generates a set of relevant widgets and filters. It uses landscaping industry knowledge, including seasonality and the differences between maintenance, design-build, and snow operations, alongside your company's Aspire data. It also considers your business structure and operations when recommending what to track. You can review the generated dashboard, make adjustments, and save it.
Recreate dashboards you already use
Companies with established reporting processes can also bring existing views into Command Center. If you rely on a particular report in Aspire or a dashboard in another tool, you can upload a screenshot and ask Command Center to recreate it.
You can also upload Excel files and use that information in dashboards and conversations with Atlas. For example, a QuickBooks export can be uploaded alongside your Aspire data, allowing you to analyze financial and operational information together. This makes it easier to work with information that would otherwise be spread across multiple systems.
Keep your team informed without extra reporting work
Command Center also includes tools to share performance information and prepare for regular business reviews. Whether you want to display production metrics in the office or distribute financial reports before a meeting, you can make that information available without repeatedly building and sending reports.
Put your dashboards on the big screen
TV Mode turns any dashboard into a large-screen display for your office or shop. Production managers, branch leaders, and other team members can view important metrics throughout the day without opening individual reports.
You can set the display to automatically scroll through widgets, pin a specific metric, and refresh at intervals ranging from one to 20 minutes.
Start with an Analyst Briefing
When you open Command Center, the home screen includes a search bar where you can ask a question, look up a metric, or navigate to a dashboard. It also includes an Analyst Briefing, which reviews your Aspire data and summarizes recent business activity, highlighting information that may deserve attention.
If the briefing identifies something you want to investigate, you can ask Atlas follow-up questions directly from the home screen.
Run and schedule reports
Command Center includes prebuilt reports, such as AR aging by property, that run a fresh query when opened. You can also subscribe to reports and dashboards for automatic email delivery on a regular schedule.
For example, if your production meeting takes place every Thursday, you can schedule the production report to arrive Wednesday so everyone has time to review it beforehand.
Stay ahead of problems and opportunities
Command Center doesn't just help you find answers. With email alerts, you can also monitor key business metrics and surface issues or opportunities you may not have thought to look for.
Monitors let you set alerts for specific business conditions, such as when an employee reaches 32 hours for the week or labor efficiency falls below your target. Instead of repeatedly checking reports, Command Center can notify you when a metric needs attention.
Insights goes a step further by identifying trends, problems, and opportunities based on the dashboards you use. For example, it could flag customers who purchased seasonal color last year but haven't signed up this year, giving your sales team a chance to follow up before the season gets underway.
See Command Center in action
You've already put the work into capturing your business data in Aspire. Command Center lets you get more from it, with faster answers, customizable reporting, and tools to spot problems that might otherwise go unnoticed.
Whether you're managing one branch or several, you can track the numbers that affect profitability, investigate performance issues, and make decisions using current business information.
Request a demo to see what Aspire Command Center can do for your business.






 866-727-7473
 Schedule Demo
 390 S Woods Mill Rd #300 Chesterfield, MO 63017


