BLOG
Welcome to the Aspire Blog
Practical advice and tools to help you run your field service business.
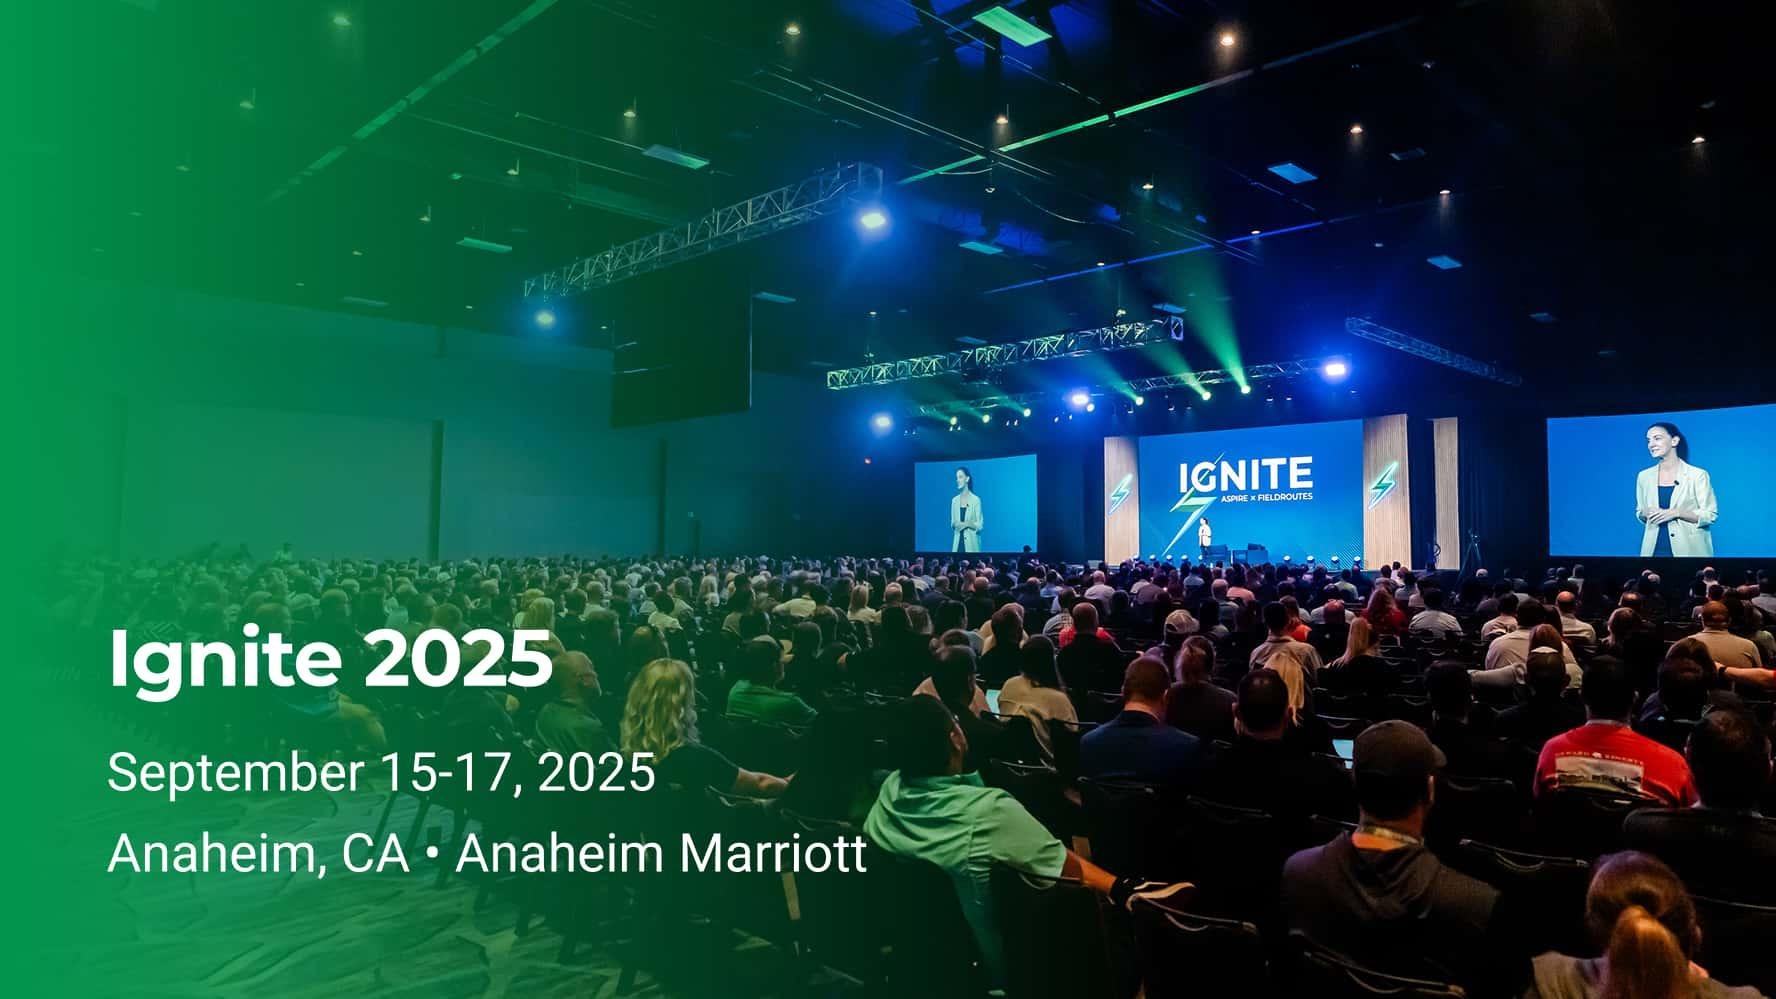
Ignite 2025 Live Blog
Join 1,000+ contractors and industry leaders at Aspire’s Ignite 2025. Three days of product...
Aspire Software
September 16, 2025All
Business
Landscape
Software
5 min read
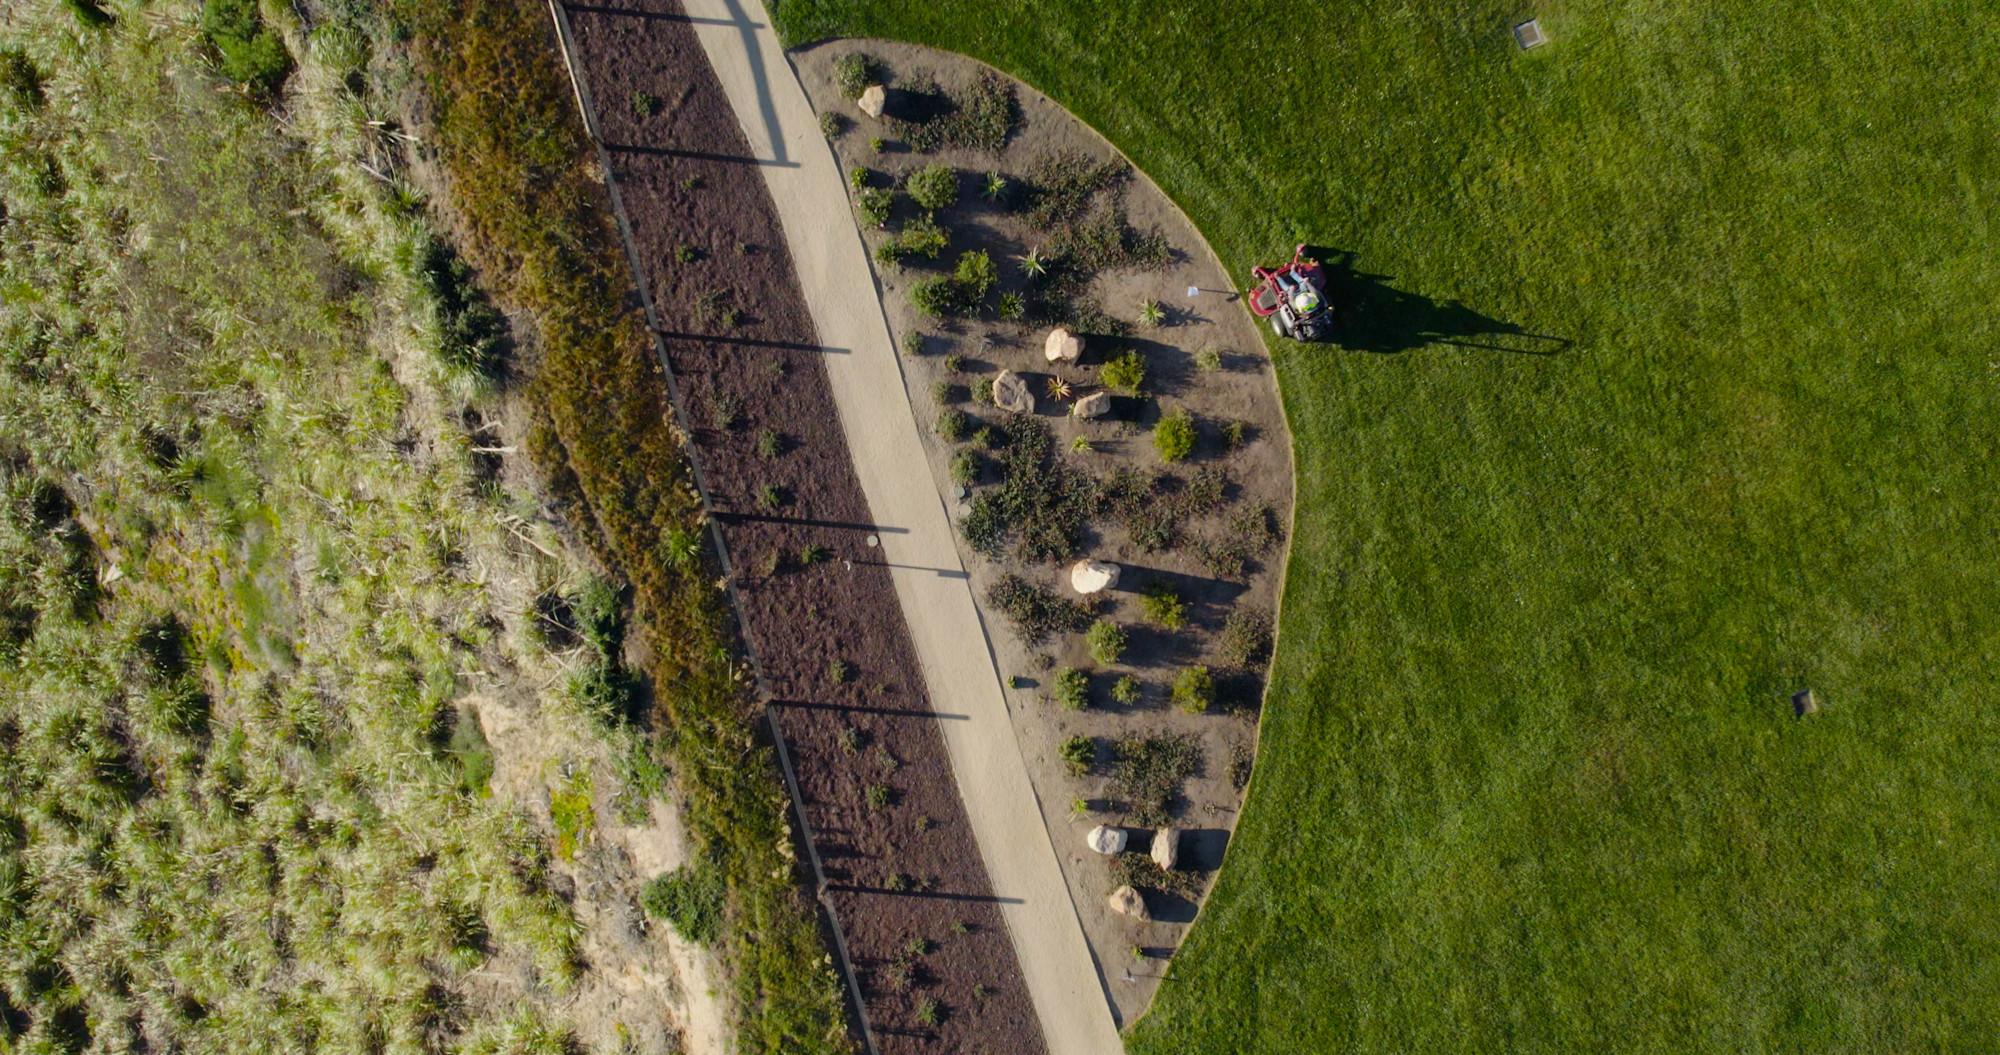
Paul Hansen helping Southwest Landscape fulfill the promise
VP Paul Hansen transformed Southwest Landscape's profit margins from 3% to 18% and doubled revenue by splitting client services & account management and leveraging Aspire's budget tool.

May 8, 20269 min read
Start Strong with Aspire: Data Migration that Doesn't Break Your Ops
Don't let DIY data migration break your landscaping business. Learn Aspire's structured, expert-led process to move your data correctly, avoid operational debt, and go live with confidence.
May 8, 202611 min read
How to Price Snow Removal Jobs for Profit & Fairness
Learn how to price snow removal jobs effectively for both residential & commercial clients. Cover labor, equipment, overhead, & seasonal pricing models.
May 8, 202611 min read
Colorado Landscaping Business License: Complete Guide
Learn how to start a landscaping business in Colorado. Explore license requirements, costs, & steps to stay compliant with state and federal laws, & more.

May 7, 20262 min read
When Video Never Lies: How Fleet Technology Protects Contractors & Drives ROI
Learn how Aspire + Azuga fleet technology helps landscaping contractors reduce liability, prevent accidents, and increase ROI with real video evidence.
May 7, 202616 min read
Guide on How to Start a Snow Removal Business
Learn how to start a successful snow removal business with key tips on pricing, marketing, and customer retention for long-term success.
May 7, 202612 min read
Markup for Landscaping Business: The Complete Guide
Discover how to set the right landscaping markup to boost profits, stay competitive, and price jobs with confidence.
May 7, 202610 min read
Ohio Landscaping Business License: Complete Guide
Learn how to start a landscaping business in Ohio. Explore license requirements, costs, & steps to stay compliant with state and federal laws, & more.

3 min read
The Cool Landscape Company
Site Landscape President Andrew Craft scaled from $20M to $40M using Aspire and a tech stack that drives operational efficiency, data analytics, and better hiring.
get started
Find the solution that's right for you
Aspire is here to help you achieve your goals. Tell us what you’re looking for and we'll match you with a solution that meets your needs.


