BLOG
Welcome to the Aspire Blog
Practical advice and tools to help you run your field service business.
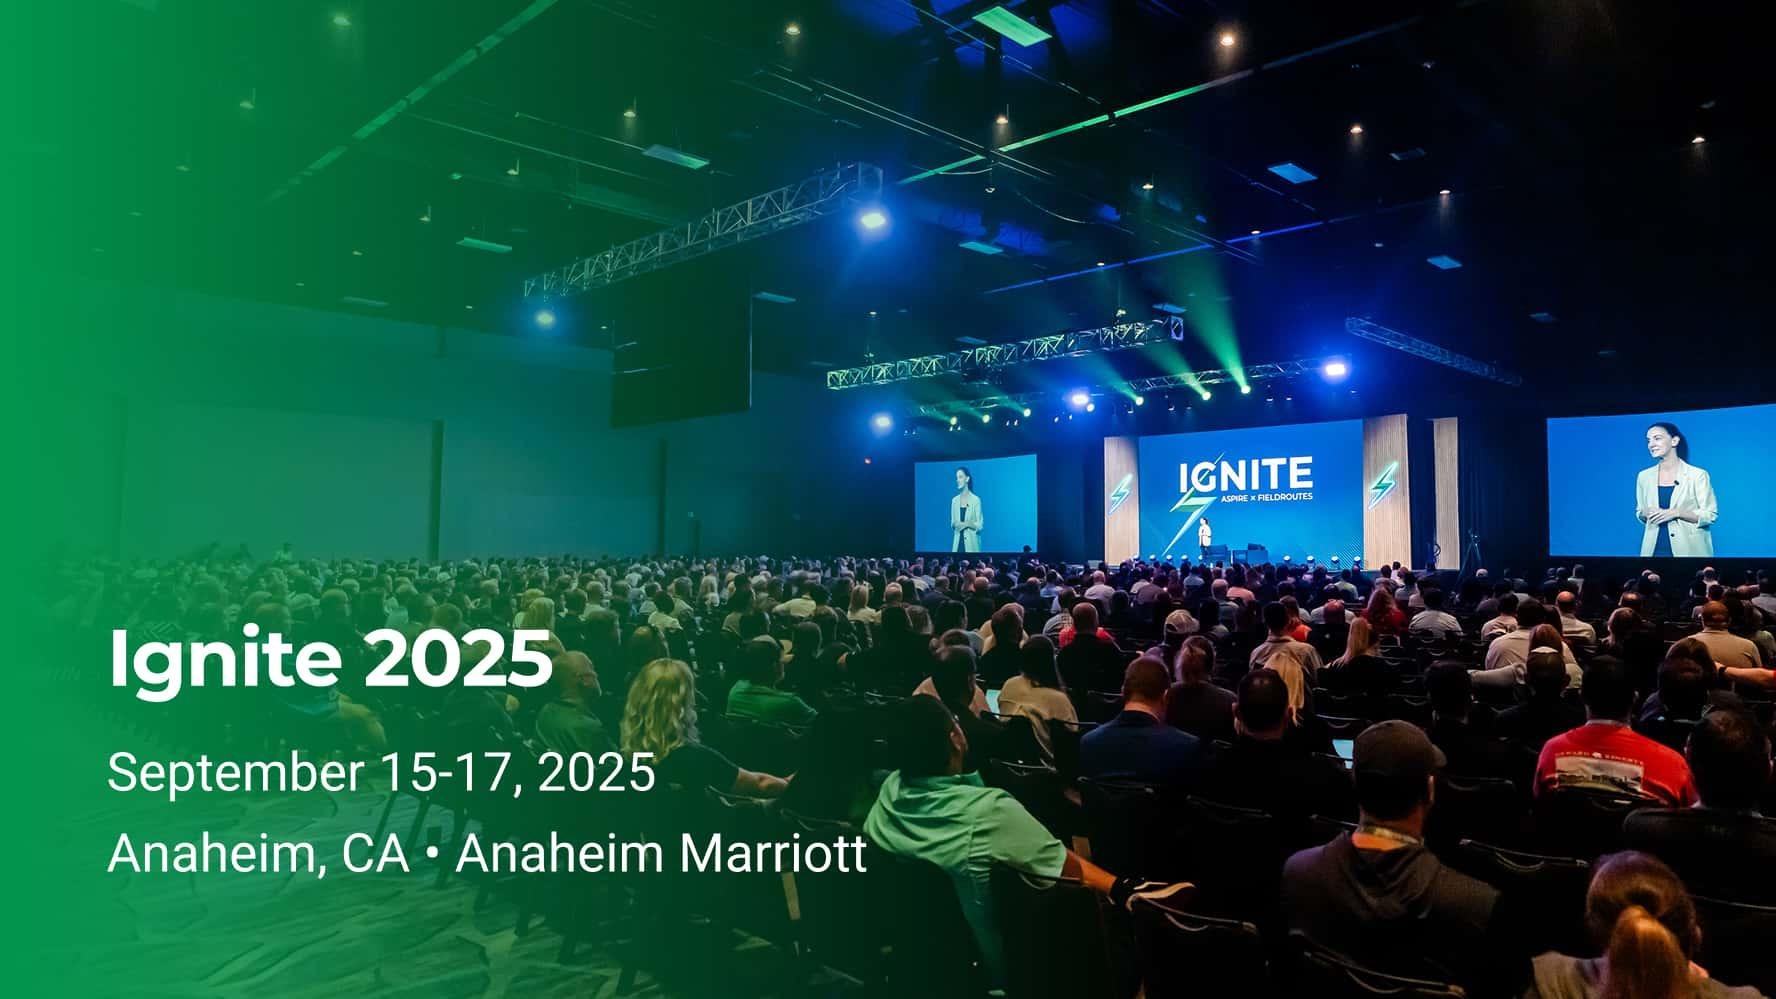
Ignite 2025 Live Blog
Join 1,000+ contractors and industry leaders at Aspire’s Ignite 2025. Three days of product...
Aspire Software
September 16, 2025All
Business
Landscape
Software

3 min read
The Cool Landscape Company
Site Landscape President Andrew Craft scaled from $20M to $40M using Aspire and a tech stack that drives operational efficiency, data analytics, and better hiring.
April 28, 20263 min read
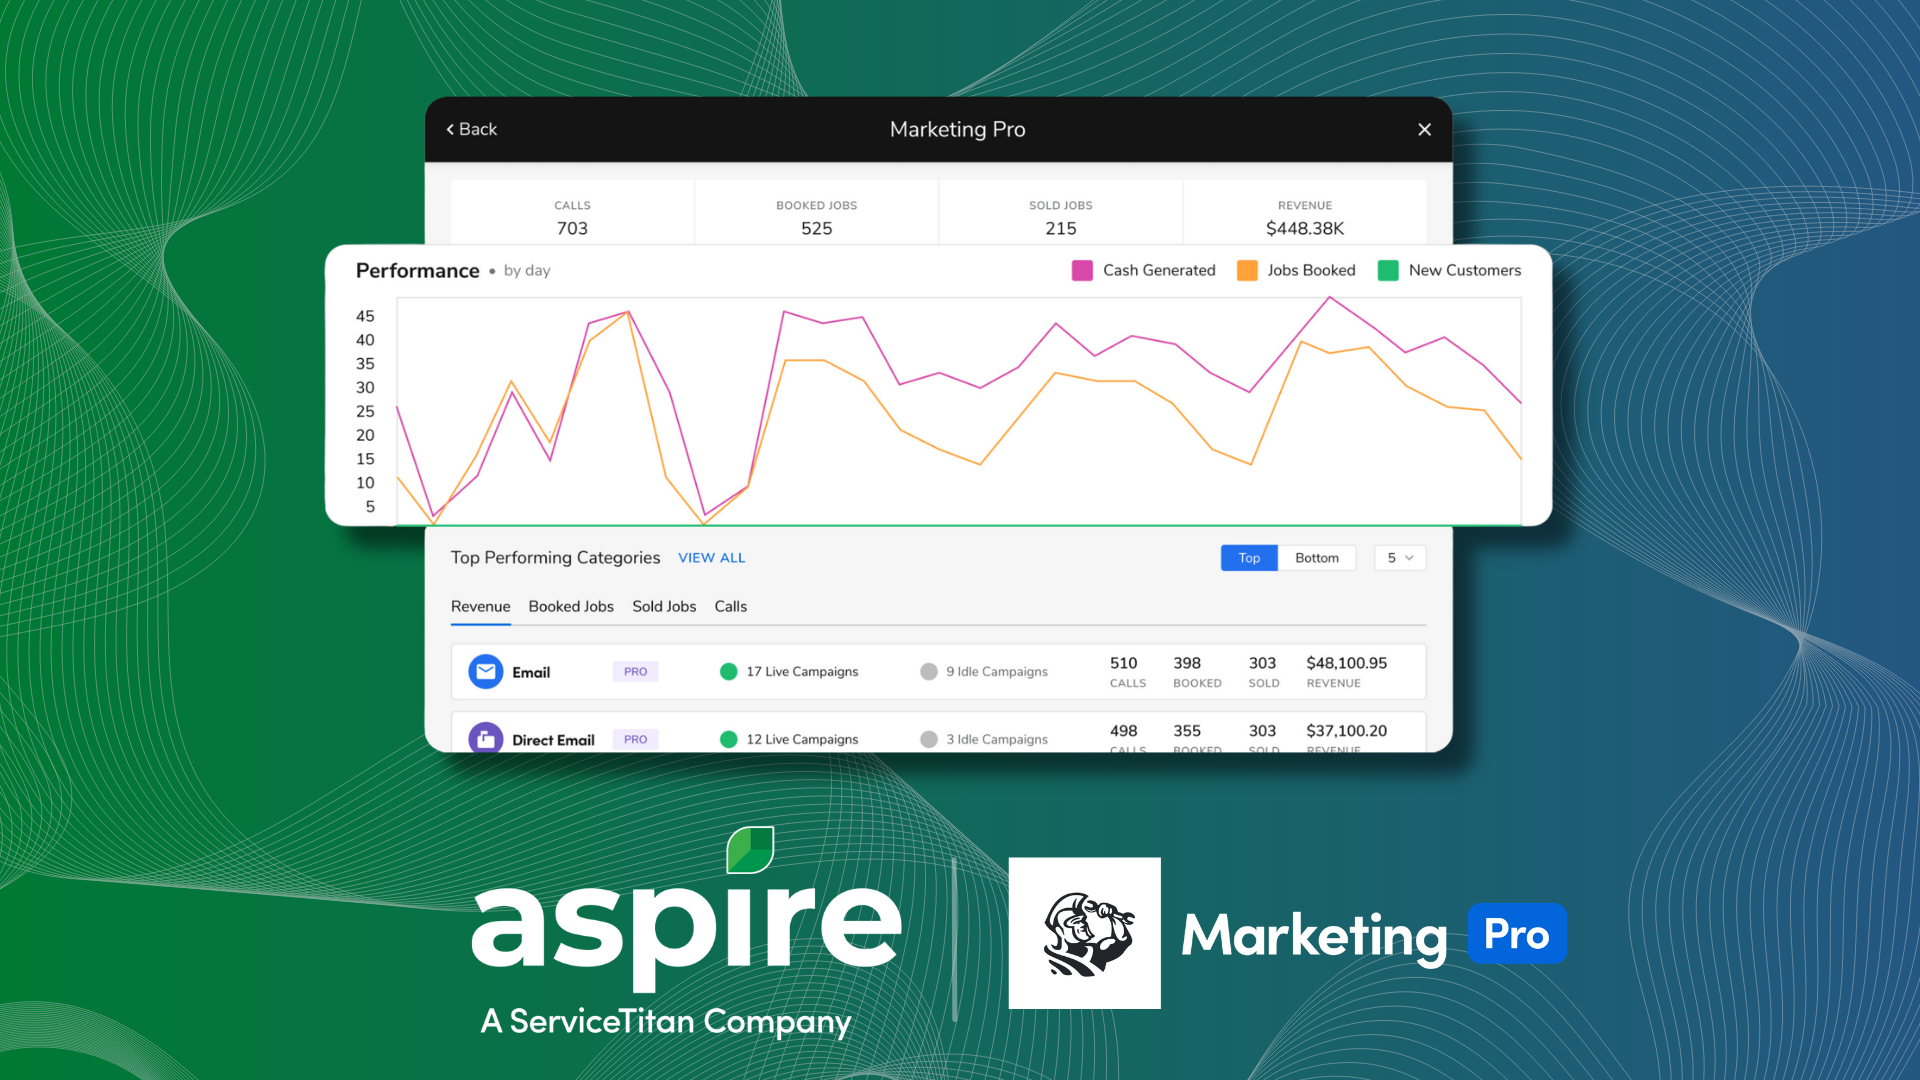
1 Branch. 5 Emails. $194,622 in Influenced Revenue.
Michael Palmer spent his first months at Schill Grounds Management doing a listening tour. What he found was inconsistency. What he built was a system, and now the results speak for themselves.
4 min read
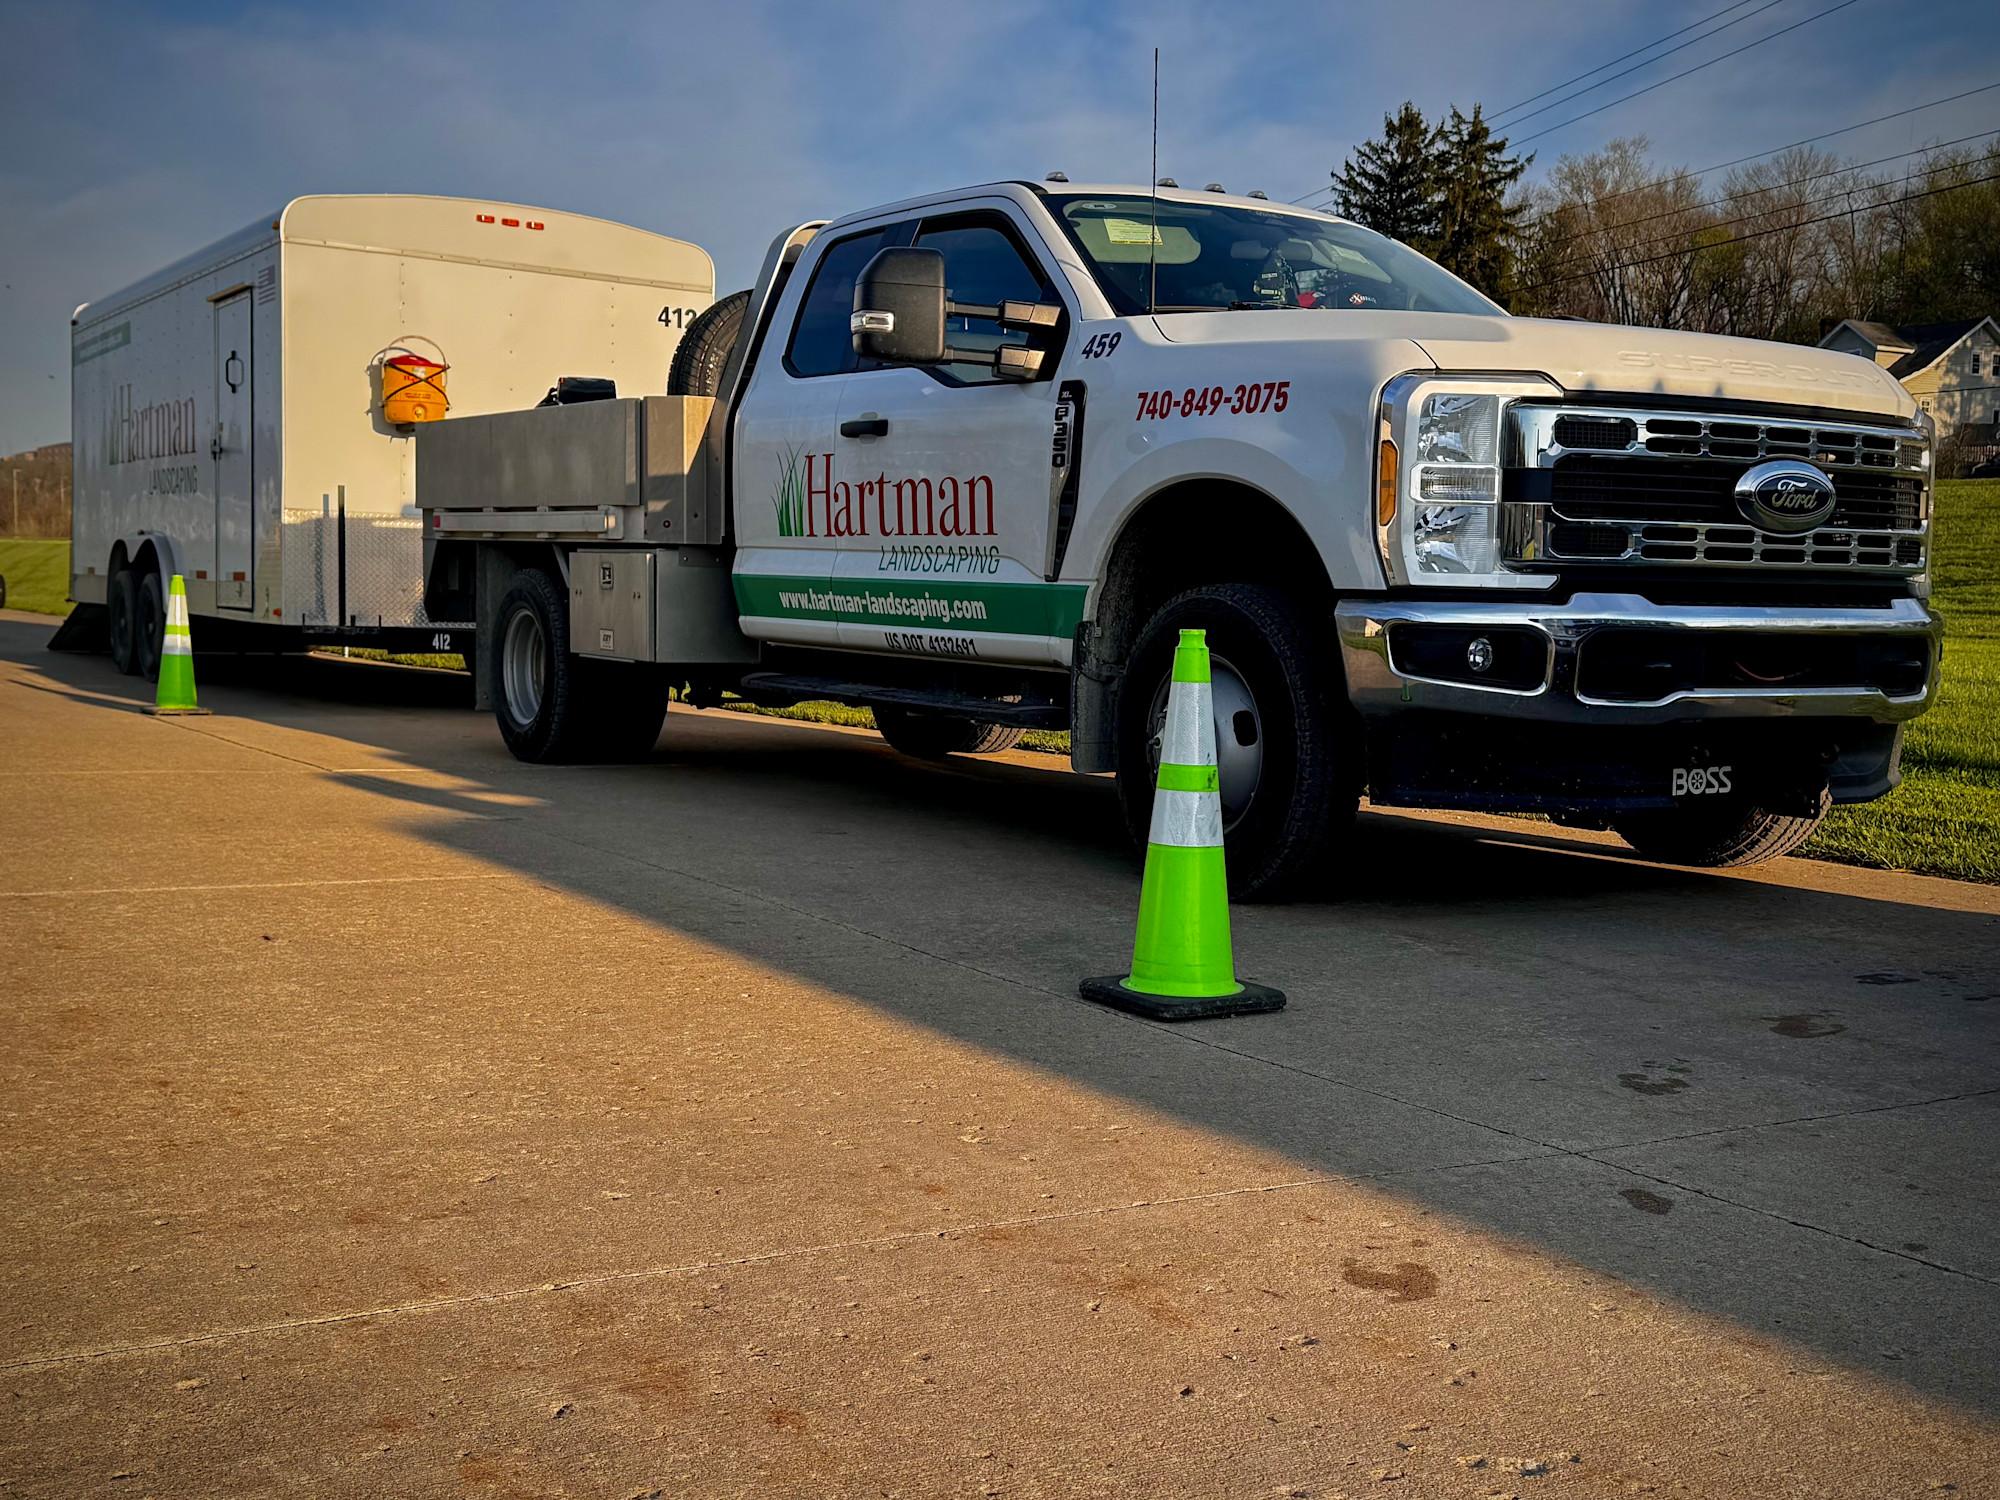
You Can't Fix What You Can't Measure
How Beau Hartman built a $6.8 million landscaping company in Ohio and learned the hard way that the right software isn't a cost. It's the foundation.

April 24, 20269 min read
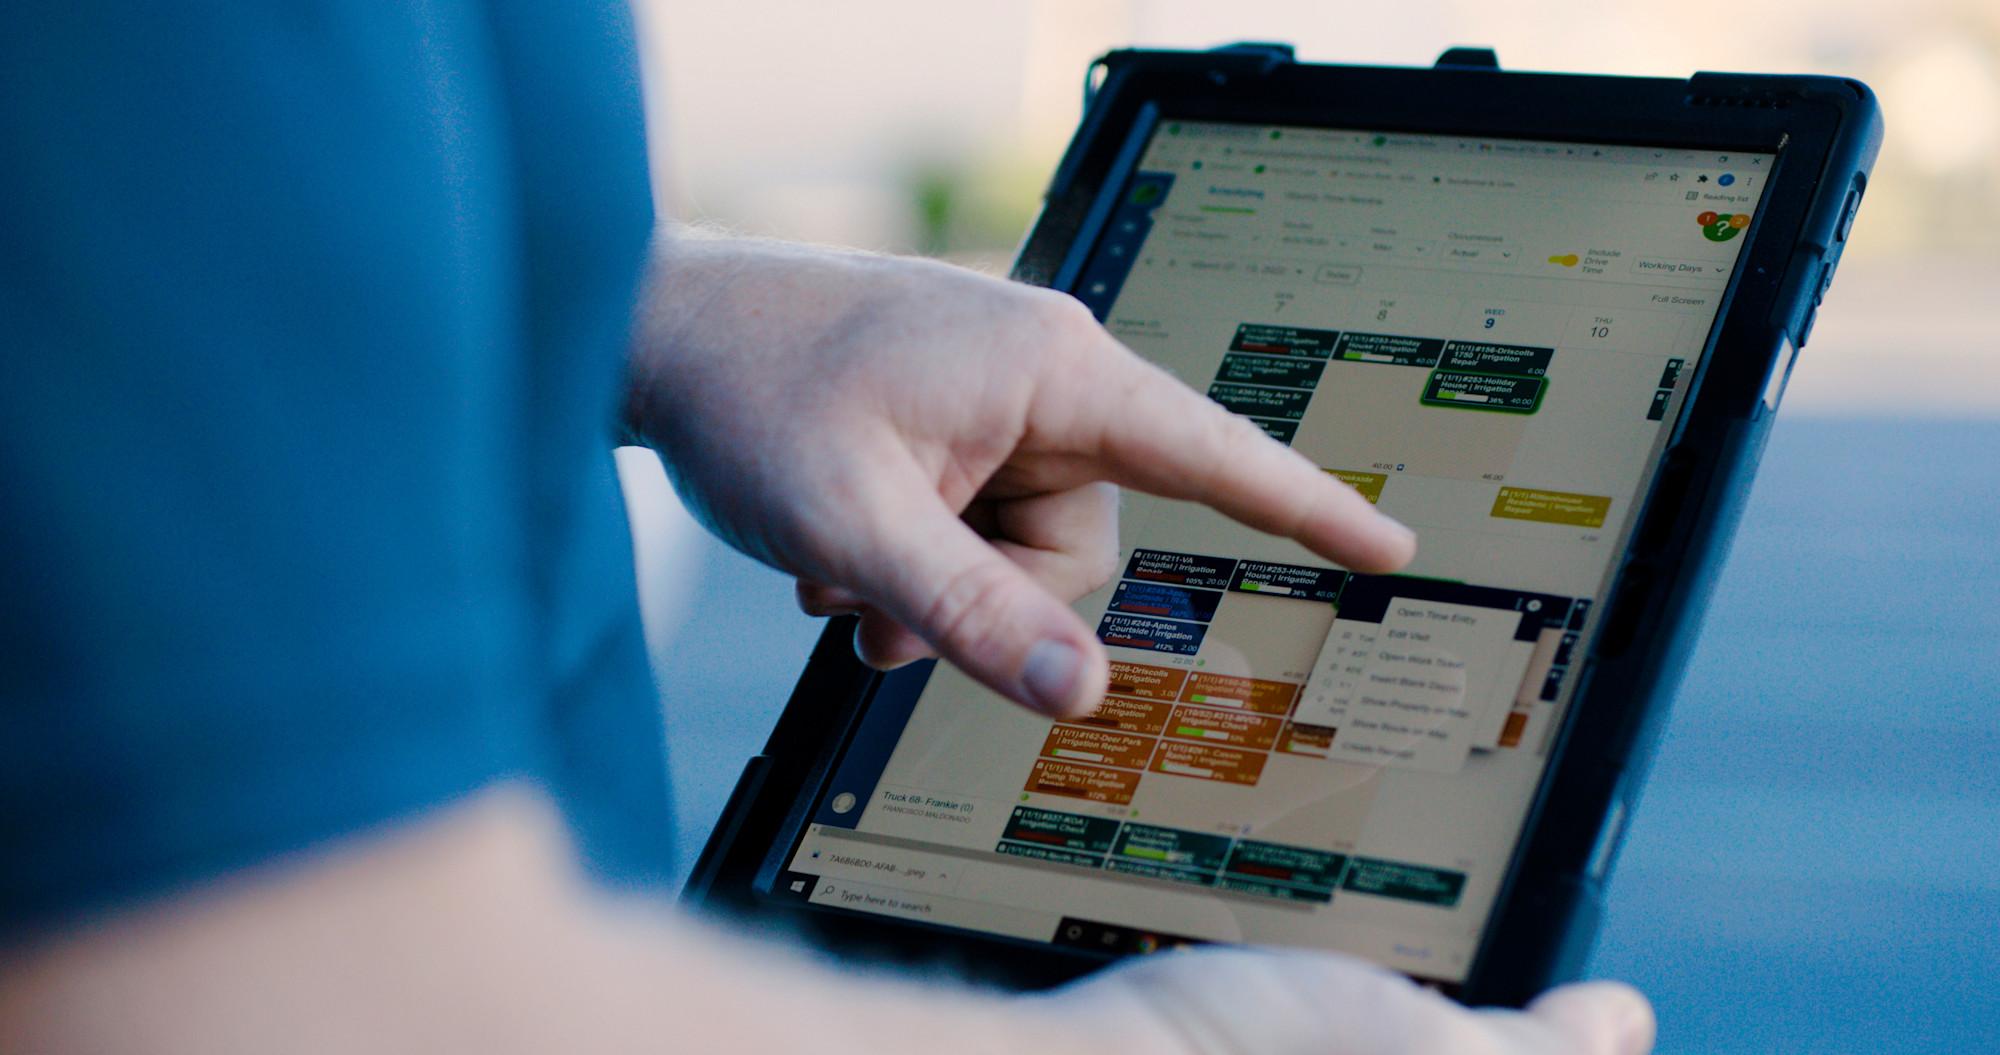
Profit Killers: How Disconnected Systems Drain Growth (and How to Stop It)
Disconnected systems are silently draining your landscaping company's profits through hidden inefficiency, errors, and lost time. Discover how a unified platform restores control and accelerates growth.
April 23, 20267 min read
Navigating Change in the Digital Age: A Practical Guide to Change Management
Worried about tech disruption? Learn Aspire's practical change management framework for landscaping businesses. Reduce employee resistance, build team confidence, and achieve lasting operational success.

April 22, 20267 min read
The Profit Starts Here: How Smarter Estimating Drives Sustainable Growth
Stop losing money on inaccurate bids. Learn how data-driven, standardized estimating with Aspire and PropertyIntel fixes common errors, eliminates delays, and accelerates cash flow for scalable growth.

April 21, 20267 min read
Scaling Success: How Aspire Partnerships Propel Business Growth
Landscaping companies that scale with precision use Aspire's partner ecosystem. Discover five key dimensions—from integrated software to strategic execution—to grow smarter and build a durable competitive advantage.

April 21, 202610 min read
Budget Meetings Translated: What Everyone Really Means (and Actually Getting Things Done)
Stop budget battles. Translate departmental requests (Capacity, Growth, Efficiency) into unit economics, margin impact, and cash flow timing. Use 3 scenarios to align teams and make profitable decisions.

April 17, 20266 min read
From Mom-and-Pop to Exit-Ready: How Modern Tech Turns Landscaping Companies into PE-Grade Assets
Private equity buyers look for systems, not just revenue. Discover the tech roadmap to make your landscaping company scalable, trustworthy, and command a top-dollar PE valuation.
get started
Find the solution that's right for you
Aspire is here to help you achieve your goals. Tell us what you’re looking for and we'll match you with a solution that meets your needs.


