BLOG
Welcome to the Aspire Blog
Practical advice and tools to help you run your field service business.
Ignite 2025 Live Blog
Join 1,000+ contractors and industry leaders at Aspire’s Ignite 2025. Three days of product...
Aspire Software
September 16, 2025All
Business
Landscape
Management

June 5, 20268 min read
Acquisition Implementation, Without the Chaos: Rolling New Branches into Aspire
Acquisitions fail with identical onboarding. Aspire offers tiered implementation packages to match support intensity to deal complexity, preventing chaos and protecting M&A profit.

June 4, 202612 min read
The Data-Driven Proposal: How to Use Job Costing Data to Justify Your Premium Price
Stop defending your price. Learn how premium operators use job costing data as a strategic weapon to justify higher bids, demonstrate operational discipline, and manage risk for sophisticated buyers.

June 3, 20269 min read
The Data Maturity Model for Landscape Operations: A Five-Pillar Framework for Margin Leaders
Stop operating blind. This 5-pillar data maturity model shows $10M+ landscape operations how to move from reacting to predicting, closing margin gaps, and capturing seven-figure advantages.
June 2, 20263 min read
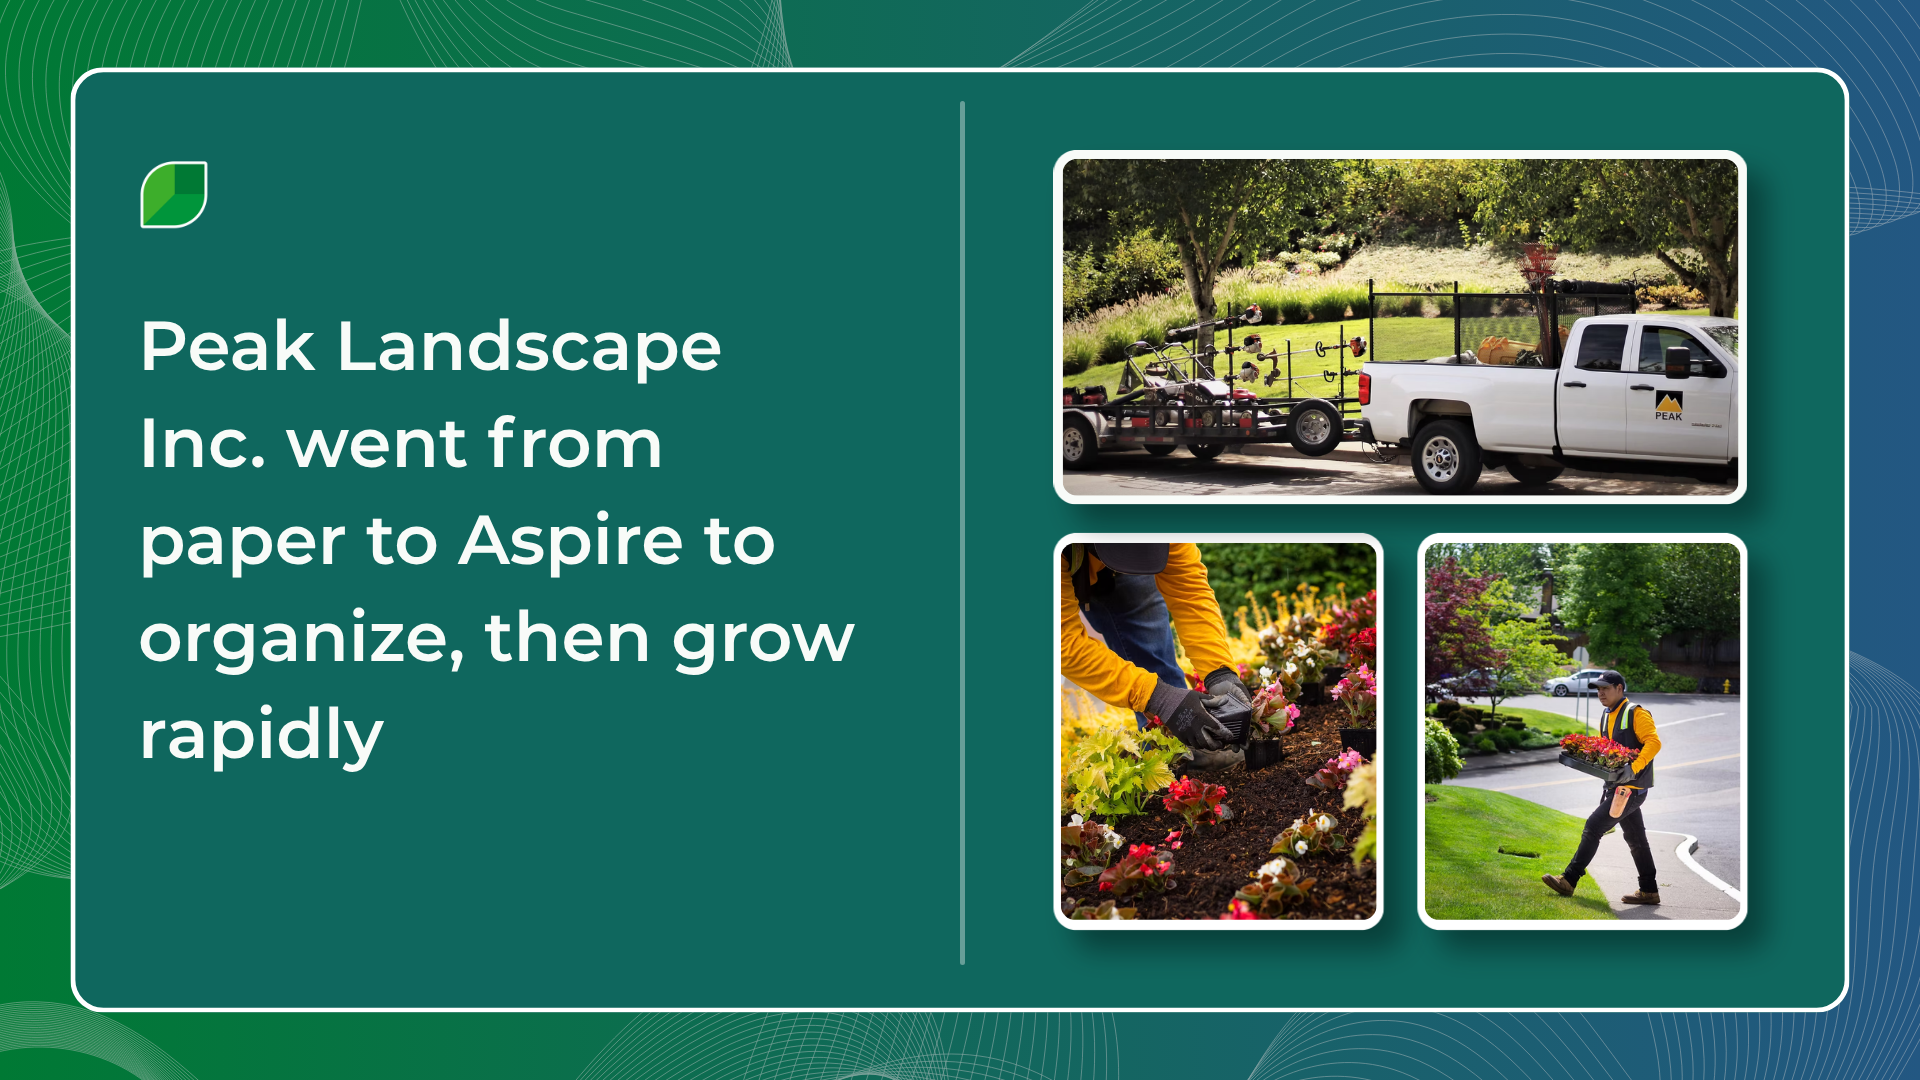
Peak Landscape Inc. went from paper to Aspire to organize, then grow rapidly
When Peak Landscape hit $6 million, the paperwork was breaking them. Five years and 170 employees later, the numbers tell a different story.
June 1, 20267 min read
Pre-Positioning Resources: The Equipment & Materials Playbook for Spring
Reactive procurement destroys your peak season profits. Learn the 4-step pre-positioning framework to map equipment, materials, and subs to your contract backlog before demand drives up costs.

May 29, 20269 min read
Growth Planning with the Pros: From Today's Bottlenecks to Next Year's Wins
Stop guessing your 2026 growth plan. Aspire Pro Services acts as your fractional operations consultant, using your data to diagnose bottlenecks and build an executable roadmap for profitable scaling.
![Business License for Snow Removal: Complete Guide [2026]](/_next/image?url=https%3A%2F%2Fimages.ctfassets.net%2F3cnw7q4l5405%2F54vTHqiZECCBsUE6QSgrDV%2F3102ace7fa87221aed84ecc035608461%2FBusiness_license_for_snow_removal.png&w=3840&q=75)
May 29, 20268 min read
Business License for Snow Removal: Complete Guide [2026]
Learn the requirements, costs, and steps to get a snow removal business license, plus tips to stay compliant and avoid penalties.
May 29, 202610 min read
Boost Your Snow Removal Business Marketing Success
Explore snow removal business marketing strategies to boost visibility, attract clients, & drive growth. Tips for SEO, social media, & advertising included.
May 29, 20268 min read
What Is the Cheapest Way to Advertise a Landscaping Business?
Discover the most effective and cost-efficient advertising methods for your landscaping business—online, offline, word-of-mouth, and more.
get started
Find the solution that's right for you
Aspire is here to help you achieve your goals. Tell us what you’re looking for and we'll match you with a solution that meets your needs.


